This is a story of a Type 1 diabetic’s experiment with resistant starch. She follows a high fat, low carb paleo style meal plan. If you are a newbie to Resistant Starch read this, “Diabetes and Resistant Starch Experiment“.
- Resistant Starch may even help Type 1 Diabetes
- Improving our gut health is never a bad idea
I suggest that people, especially diabetics use Bob’s Red Mill Potato Starch as their source for resistant starch. There is resistant starch in ‘real’ foods but that’s problematic; most foods high in resistant starch are very high in carbs.

Next let’s talk about the Type 1 diabetic conducting the personal experiment.
Type 1 Diabetic
She has successfully faced the gauntlet all diabetics face who attempt to go ‘low carb paleo’, friends, family, doctors who all try to convince her to quit and return to the failed “conventional” carb up and shoot up diabetes treatments.
Additionally she faced scrutiny and pressure when she became pregnant and decided to have a VBAC while on a low carb paleo diet. I wrote about her here, “Pregnancy and Diabetes“.
Most type 1 diabetics produce at least some insulin, her pancreas produces -0- insulin, that’s very unfortunate for her but makes her a great ‘test subject’ for conducting food/nutrition experiments.
Resistant Starch Diabetes Experiment
She generally has good control but has been dealing with hormonal issues that have caused weight fluctuations as well as recent fluctuations in her carbohydrate to insulin ratio, making it more difficult for her to manage her blood sugar levels.
When I mentioned my own Resistant Starch (RS) experiment she was eager to give it a try. Her experiment began December 8th, she takes (1) TBS of potato starch, (4) times a day. She’s using the recommended brand of Bob’s Red Mill Potato Starch.
Blood Sugars Before Resistant Starch
If you can’t nail down an insulin to carb ratio, you don’t know how many units of insulin to take per gram of carbohydrate consumed. Therefore she’s been riding a roller coaster ride with her blood sugars recently.
Below is a screen shot of her continuous glucose meter (CGM), this is a 24 hour period.
The green horizontal zone is the desired target range. 65-120 mg/dl. Outside that range and she is alerted with a warning.
As you can see, her blood sugar stayed elevated for long periods of the time and when she was able to bring it into normal ranges, it creeped back up again.
Picture the scenario below … everyday for months. For those who follow the ADA’s ‘carb up and shoot up’ diabetes protocol, the diabetes roller coaster would be much worse, imagine that for years or decades.
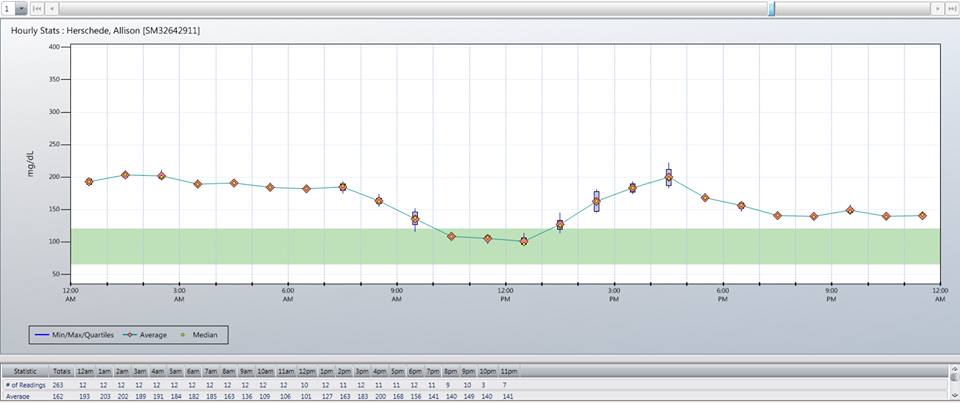
In the example below you can see that she was able to stay in the ‘Target Range’ for longer periods of times… however, what a Roller Coaster ride it was.
If you are serious about maintaining normal blood sugars, (and you should be) this can be very stressful.
Resistant Starch Early Results
Now for the ‘good news’. She started her resistant starch experiment on December 8th. After a week she commented on the improved insulin to carbohydrate ratios.
She said, “I just ate 30g of vegetables, ordinarily that would have sent me to 200 mg/dl”. When she eats foods that raise her blood sugar, she must ‘bolus’ or take insulin in addition to her basal insulin.
The hope is that the amount she takes will match what she’s eaten and she’ll stay level. That’s why a steady ‘ratio’ or at least a more steady ratio of insulin to carbohydrates is so important.
After one week, her insulin sensitivity has indeed improved because she was able to take HALF her normal bolus insulin for the 30 grams of vegetables with only a minimal blood sugar spike to 110 mg/dl.
… this is HUGE!
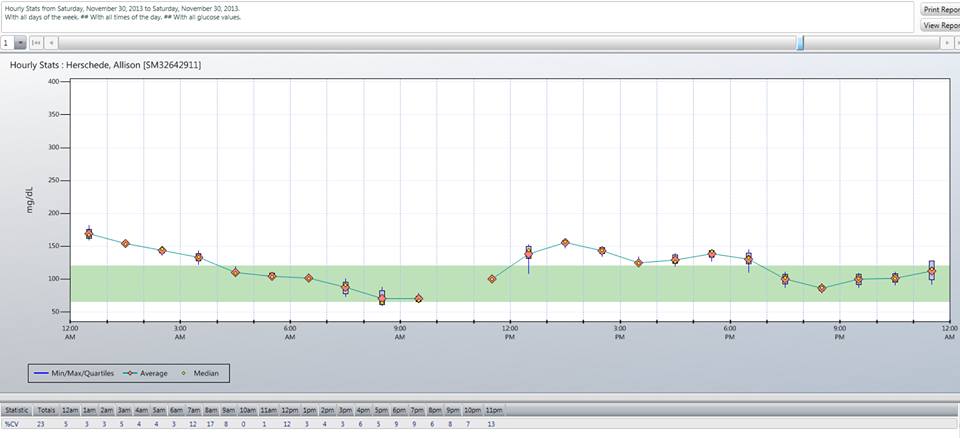
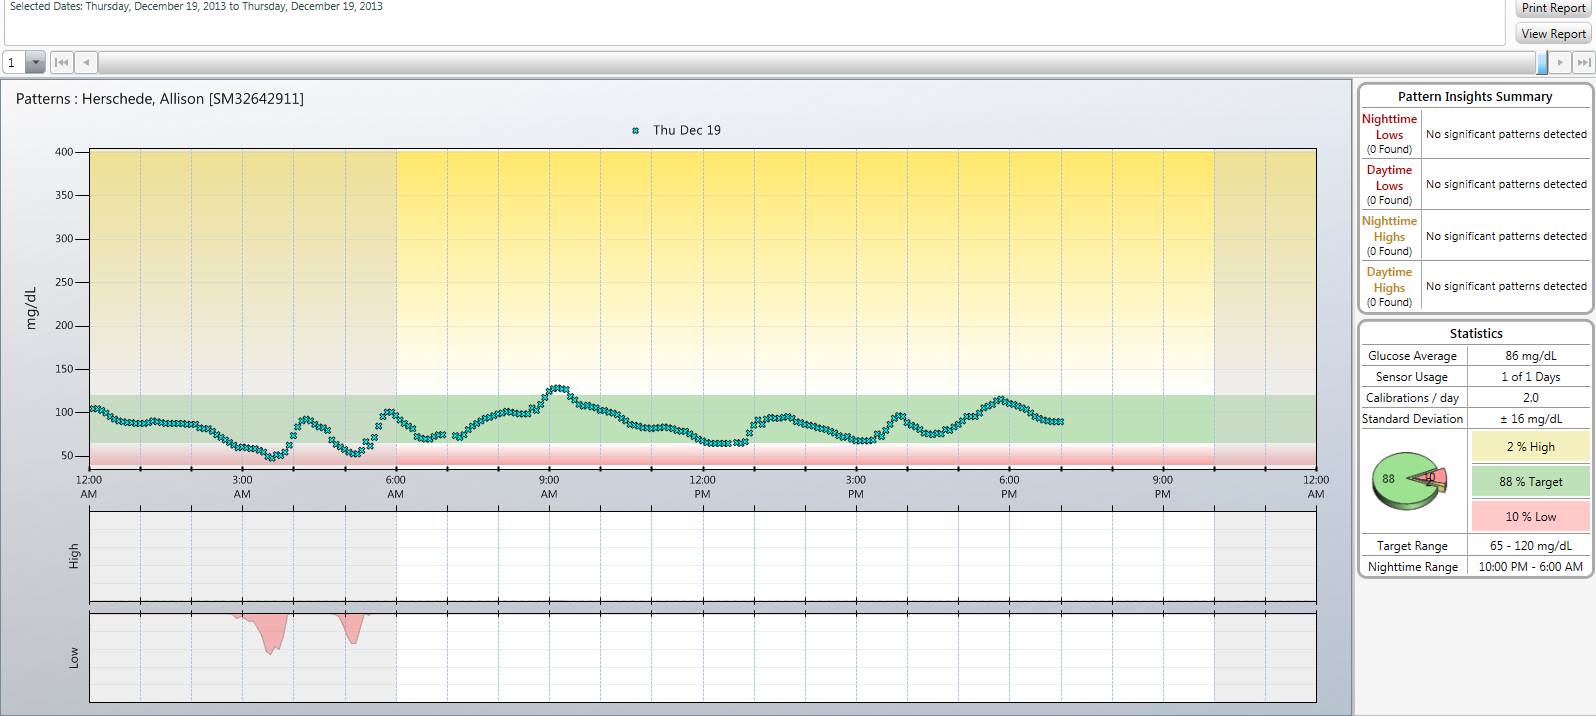
Blood Sugar Chart on Resistant Starch
Now for the ‘good’ graph, this was taken yesterday 12/19/13.
Notice the DIFFERENCE!?!
She stayed in the normal range MUCH LONGER!!!
Yes there were ebbs and flows but almost all were in the ‘target zone’!!!
Yes, she did have a couple of lows that are worrisome…. but this is due to the INCREASED Insulin sensitivity. She can (and will) adapt to this by adjusting her insulin rates!
Resistant Starch Experiment Wrap Up
Her ability to control her blood sugars greatly improved. It’s impossible to say with certainty that Resistant Starch was a major reason, or even contributory.
But facts are facts. After taking Resistant Starch (Bob’s Red Mill Potato Starch) she’s taking less insulin and experiencing less of the diabetes roller coaster ride, reducing the time spent in organ damaging, elevated blood sugar ranges.
The blood sugar roller coaster ride is not healthy physically nor mentally.
Her type 1 diabetes, resistant starch experiment is confirmation of what I have seen personally as well as what Richard Nikoley HAS BEEN reporting for months! Resistant starch *can* be a tool to help diabetics obtain better control of their blood sugars.
If you do not have normal blood sugars… I hope that you have seen enough to at least give Bob’s Red Mill Potato Starch a try.
Here is my first post on Resistant Starch, “My Experiment”.
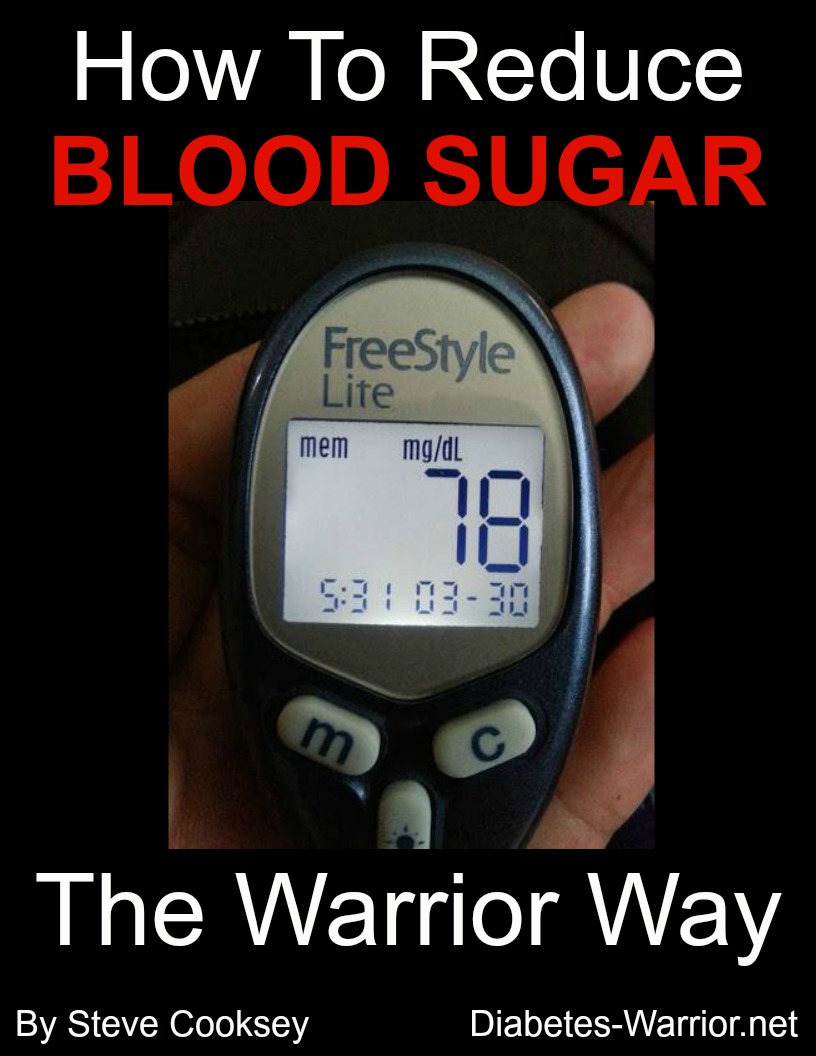
Lower Your Blood Sugar Naturally
If your blood sugars are elevated and you cannot achieve truly normal blood sugars with diet alone…
READ MY BOOK! How to Reduce Blood Sugars.
Is she taking 4 tbsp PS once a day at bedtime?
I think she takes it during the day, I’ve emailed her this question. Will report back. Apologies for the delay. :)
Pingback: It's all over but the crying. Resistant Starch Day 25 Test